Joseph Petzval and the dawn of modern lens design

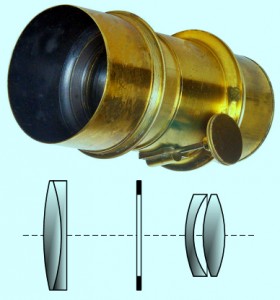
Figure 1 – An example of one of Joseph Petzval’s lenses.By Szőcs TamásTamasflex (Own work by uploader – Lens Photo by Андрей АМ) [CC-BY-SA-3.0 (http://creativecommons.org/licenses/by-sa/3.0) or GFDL (http://www.gnu.org/copyleft/fdl.html)], via Wikimedia Commons

In reading the January 2013 issue of Shutterbug (Is it really 2013 already?), I came upon an interesting excerpt from “Pring’s Photographer’s Miscellany” about Joseph Petzval (1807-1891) that was worth looking into further.  Petzval was a Slovakian physicist and eventually chair of Mathematics at the University of Vienna. He was the first person to design camera lenses mathematically; so in that respect was the father of geometric optics and modern lens design.  There is a wonderful Antique and Classic Cameras website that offers an excellent discussion of  early camera lenses.

The bottom line is that early Daguerreotypists were plagued by the very high f-numbers of their cameras and the long exposures that they consequently demanded.  The original lens that Daquerre used was a  cemented doublet achromatic Chevalier 15-inch telescope objective with an f-number of 15.

Petzval’s innovation was to design a  pair of doublets, where the second doublet compensated for the aberrations of the first.  This produced a sharp image at the center with a softer focus off center as well a vignetting at the edges.  Such a lens was ideal for portraiture, where the goal is to focus the eye on the subject not the background.  Indeed, Petzval lenses are still manufactured today so as to achieve just this effect.

At f/3.6 this lens was almost 25 times faster than the original Chevalier lens.  This made sitting times for portraits manageable, even for children. In this respect, Petzval may be credited with contributing significantly to the development of modern photography.

Petzval initially teamed with Voigtlander & Sons to produce his lens.  Utimately, Petzval fell out with Peter Wilhelm Friedrich von Voigtländer (1812–1878) .  Patent laws were problematic in the 19th century; so they continued to produce copies of his lens design and there was a dispute as to who held the legal right to manufacture these lens.   In 1859, Petzval’s home was burglarized and his manuscripts and notes were destroyed.  He never was able to reconstruct all of his previous work and he ultimately withdrew from society and died a destitute hermit in 1891.  This seems, sadly, to be a common epilogue for the photographic geniuses of the 19th century.

Random noise, counting noise

So let’s build on what we know about noise. The operative word for the day is random.  Suppose we have a camera sensor and we look at what is happening to a single pixel.  Let’s suppose that there are about 100,000 photons of light randomly hitting that pixel every second.  The pixel builds up charge in response to the light (which means it converts those photons to electrons and somehow counts them).  For now, we’ll assume one photon creates one electron.

OK, now assume that you read the amount of light every microsecond (one millionth of a second).  What this means is that most of your microsecond intervals are going to be empty.  In fact, only one in ten on average will have photon.  Or put another way, the probability that any given microsecond contains a photon is 1/10.  By-the-way, this means that the probability of catching two photons in an interval is (1/10)X(1/10) or 1/100 or 1%.

The point is that there is a lot of variability.  Because the photons are discrete and their delivery random, you cannot get 0.1 photons in an interval which happens to be the average.  Most (~90%) of the time you get 0.  Some (~10%) of the time you get 1.  And rarely you get 2, 3, 4, etc.

If you instead count for 2 micron intervals, ~80% of the time you get 0 and ~20 % of the time you get  1.  The odds of a 2 go up to 2.5%.  Basically, the longer the interval the less variability you get.  However unless you count for an infinite amount of time there’s always going to be variability.

Here’s the key.  Suppose your exposure (that’s your measurement interval) gives you 10,000, then there’s an uncertainty of the square root of 10,000 or 100 in the number of photons detected.  OK, I have to say it accurately at least once.  The laws of probability predict that if you made your measurement (exposure) a lot of times, 68% of the measurements would fall between 10,000-100 (that’s 9,900) and 10,000 +100 (that’s 10,100). This corresponds to a 1% uncertainty or variability.  I’m sorry I had to say it.

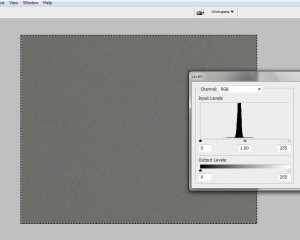
Figure 1 – Image of a grey wall and the corresponding histogram of measured intensities

The really important take home message here is that ultimately you’re counting photons (really electrons) and there’s always going to be variability, or noise, by virtue of the random way that light is delivered.

OK, so let’s prove it.  In Figure 1, I show a picture that I took of a homogeneous wall. Superimposed on this image is the histogram of the grey values.  While they’re tight they’re not all the same.  There is variability or noise even in this homogeneous image. Engineers refer to this as counting noise, and it’s inescapable.

Signal-to-Noise, an intuitive view

We all have an intuitive understanding of what noise is; so let’s start with that.  You’re sitting in a restaurant, and your boyfriend is about to propose to you.  The problem is that you’re having trouble hearing him, because of all the noise around you – the self-impressed boorish lout at the next table gfawing loudly at his own jokes, the children screaming on the other side of the room, and the large table full of intoxicated people all talking at once. Your boyfriend is nervous and speaking unusually softly.  So we have it – first background noise and second a low signal.

Engineers describe this as the signal-to-noise ratio.  When this ratio becomes less than about one, the signal becomes very hard to discern above the noise.  And recognize, that it’s not just that there is a background that’s the problem, the problem is that it varies and is random.  Your ears and your brain just don’t know how to process the sound to separate the signal from the noise.  Note, that I’m trying to distinguish between background, which if it is constant, can be easily dealt with, and noise which is random.

Let’s return to the restaurant, somebody steps up to the front of the room and starts talking into a microphone.  Suddenly, there’s a signal that is way above the noise, has a high signal-to-noise ratio, and is easily discerned.  Wait a minute you say, what about my proposal.  I’llk leave that for you to figure out.

Have you ever heard someone speak or sing into a microphone that has a loose connection that causes the amplification to vary randomly?  Sometimes the sound is high above the background and sometimes it’s low and near the background.  Well, that’s another type of noise, called signal noise.  The total noise in a system is the combination of the background noise and the signal noise.  In fact, every component of a system, say a camera system, can introduce noise.

Optical systems, like cameras, have the same issues.  For instance, fog introduces noise into your image, making it hard to see things.  It reduces the contrast.  Now in my blog of October 20, 2012, we discussed the relationship between image resolution and contrast.  Contrast is the difference between white and black.  The finer detail you want to see, the more contrast you need.  We have defined resolution in terms of the finest line separation you can still discern.  If you make it harder to discern the lines by adding noise, both to the white signal and to the black background, your resolution decreases.

By the way, I do hope that the proposal worked out!

Returning to the question of image sharpness

I’d like to pick up on the issue of image sharpness.  So maybe, we should begin by reviewing where we are, with references to earlier blogs.

  1. We discussed the pinhole camera and described how larger f-numbers (the ratio of focal length to aperture) improve depth of field and sharpness.
  2. We discussed the pixel limit of a given camera’s resolution.
  3. We considered the diffraction limit of resolution in the context of pixels.
  4. We described the concept of measuring resolution in terms of line pairs and line width.
  5. We explored the relation ship between image contrast and resolution.
  6. We developed a simple method for measuring image sharpness or resolution that can easily be implemented and we showed the results of some real-life lens.
  7. We found that with a “good lens” you can achieve resolutions close to the pixel limit.
  8. We found that for real lenses matched with a given image sensor there is an ideal diffraction limited f-number, where you will achieve your sharpest image, provided you don’t need to worry about depth of field.

All of this was meant to enable you to declare war on useless statements that you see all over the place like: “tack sharp,” “excellent resolution, and “very,very sharp.” Care to try to put these in quantitative order – as in is a “tack sharp” lens better than a “very, very sharp lens” or the other way around?  They are really meaningless descriptions.  Yet, you see them in lens reviews all of the time.

Oh yes, and we found that the IPhone camera is pretty amazing!

So in the next technical blog, I’d like to set the stage, for considering how image noise affects resolution.  And of course, noise is an important element to understanding the dynamic range of cameras and images as well.

Photography and the tanning line

All of this talk of daguerreotypes and ambrotypes and albumin prints is taking us perilously close to a discussion of photoprocesses and how they work.  So, perhaps, it would be best to begin with a discussion of tanning lines.  Everyone is familiar with tanning lines.  Stay out in the sun too long and you get a pale shadow – a negative image of your watch, your hat, or your bathing suit.

What is going on here?  Well, obviously, some of the skin is protected from the sun and doesn’t tan.  The rest is hit by the sun, mostly the UV rays, and does tan.  But what are the underlying biochemical processes?  There are two tanning mechanisms or chemistries.  The human body produces a protein called  melanin, which is designed to absorb and therefore protect the skin’s DNA from UV radiation.  There are two photomechanisms involved in the tanning process.  In the first, a rapid response, the light causes the melanin to oxidase and darken.  The second is a slower process whereby the body detects UV damage to the DNA – technically the production of pyrimidine dimers.  In response to this damage, the body locally produces more melanin and therefore absorbs more light in the exposed areas.  Note that in both cases light energy causes a chemical change that results in increased light absorption or darkening.

Tanning is a classic example of a solar gram.  You can achieve the same effect with a piece of colored construction paper.  Place a few opaque items, like keys or coins on the paper and put it in the sun for a few days.  The sun causes a chemical reaction that bleaches out the color, leaving shadows of the objects behind.

This is all fine and dandy; but there is a big problem.  If you show someone your beached paper or tanning line you are exposing it to sunlight and eventually it too bleaches in the case of the paper or tans in the case of the skin.  Early experimenters in photography had a similar problem.  They had all sorts of chemical reactions  that were caused by light, but they needed a way to fix the image – to remove unreacted  photosensitizer.  How they solved this problem is the key to the story of early photography.

Measuring camera resolution and sharpness – Part 3

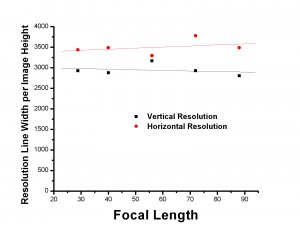
Figure 1 – horizontal and vertical resolution of the Canon S 18-55 lens on the T2i shown as line widths per image height as a function of focal length

In the second part of our exploration of how to measure camera resolution, I presented data which showed that for my Canon S 18-55 lens measured on my Canon T2i at 18 mm (actually 29 mm because of the 1.6 multiplier due to the size of the sensor element) the resolution was very close to the 3456 value for pixel limited resolution.  This mean that this lens, using this criterion for sharpness, is performing about as best as it could.

So let’s call this an example of a good lens and ask how it performs over a series of focal lengths.  That is we ask whether resolution is perserved as the lens is zoomed in.  We perform the measurement as before only holding the f-number at 7.1 and progressively moving further and further away from the target.  For each focal length we just fill the image as before.

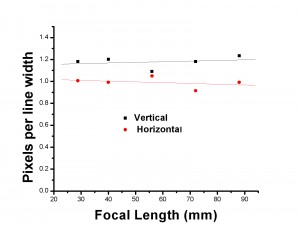
Figure 2 – horizontal and vertical resolution of the Canon S 18-55 lens on the T2i shown as pixels per line width as a function of focal length

The results of such an experiment are shown in Figure 1, where we plot line widths per image height as a function of focal length.  We observe a very flat response.  In all cases the resolution is close to the pixel limites value of 3456.

In fact, it might be more userful to consider the graph of Figure 2, where I plot the pixels per line width as a function of focal length.  For both horizontal and vertical resolution, this value is very close to the theoretical limit of 1.0.

Now that we have an example of good lens performance we are in a position to look at “bad lensed” and to examine how other factors and settings affect image resolution and sharpness.

Measuring the resolution of my IPhone

Of course, after measuring the resolution of my Canon T2i 18 MPz digital SLR, I thought that it would be fun to balance my IPhone 4S on the tripod and see what resolution it has.  Recognize that this is automatic focus and also has JPEG compression.  So this isn’t really an apples to apple comparison.  Still, I was curious how it would perform, since I am endlessly amazed at the ability of this little camera that is carried everywhere by millions.

The IPhone 4S has a remarkable camera.  It produces 8 M PZ (3264 X 2448) images on a 7.9 mm (on the diagonal) sensor.   This means ~ 2 um pixels. It has gyro-stabilization and a f/2.4 five element lens with an amazing autofocusing mechanism.  We really need to discuss some of this in greater detail.

For now, following the procedure described in the last two blogs, I found the resolution in the long axis to be 2466 line widths in the long axis and 2101 line widths along the short axis.  This is 1.3 pixels per line on the long axis and 1.2 pixels per line on the short axis. So we are again very close to the pixels limit on resolution.  So, bravo for Apple!  This is a very impressive little camera and hardly an after thought on a smart phone design.

Measuring camera resolution and sharpness – Part 2

Let’s continue our discussion of how to measure digital camera resolution.  Using the procedure described in yesterdays blog, I measured the horizontal and vertical resolution of my Canon T2i with the S 18-55 lens (not the IS variant) set at 18mm.  Multiplying by the 1.6 correction factor for the sensor size of 22.3 mm x 14.9 mm (5184 pixels x 3456 pixels) this is an effective focal length of 29 mm.  Note also that this means that the pixel size is 4.3 um on a side.

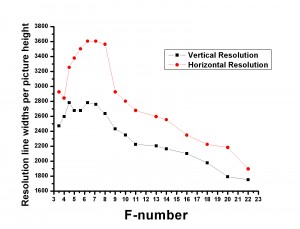
The data is shown in Figure 1.  We see three significant facts: 

  • With increasing f-number resolution rises at first and then falls.
  • The horizontal and vertical resolution are different
  • Horizon resolution maximizes at 2760 line widths per image height at ~ f-7.0
  • Vertical resolution maximizes at 3605 line widths per image height also at ~f-7.0

    Figure 1 – Horizontal and vertical resolution of a zoom lens at 29 mm zoom setting

What is the origin of the non-monotonic dependence of resolution on f-number?  We’ve actually discussed both factors previously.  In the blog on pinhole cameras, we saw how increasing f-number should increase image sharpness.  However, in the blog on Camera Resolution and the Airy disk, we saw how as f-number increases sharpness ultimately becomes diffraction limited by the dimensions of the Airy disk.  You can in fact use the simple relationship that the resolution = 1.22 X (wavelength of light) x f-number and ask when does this become equal to the pixel size of 4.3 um.  For green light (wavelength = 0.55 um) this occurs at ~ f-7.0.  Beyond that point, the diffraction spot from a point of light becomes greater than a pixel in dimension and the resolution ceases to be pixel limited and becomes diffraction limited instead.

 We can in fact calculate how many pixels wide is the diffraction spot in our test.  For instance for the horizontal data the image is 5184 lines wide, as defined by the pixel number, but only 3606 lines wide as defined by our measurement. This means a line is 1.4 pixels wide horizontally.  A similar calculation gives you 1.2 pixels wide vertically.

 All of this would appear to say that, at least at 29 mm zoom, this lens is performing very close to the pixel limit.  It also suggests that best-performance f-number of 7.0 is sensor rather than lens dependent.  This best-performance value is referred to as the DLA, for diffraction limited aperture, and matches the expected performance of the camera.

Measuring camera resolution and sharpness – Part 1

Following on our discussion of digital camera resolution, we are now in a position to actually make some measurements.  As we’ve already seen there are a number of ways to define resolution.  Following our earlier discussion of pixel limited resolution, let’s start with the question of how many line pairs (black and white) your camera can detect in the image height or width.  Another way to ask the same question is how many line widths are there in the image.  One line pair equals two line widths.  On my Canon T2i the sensor is 5184 X 3456 pixels.  So these are the maximum values for horizontal and vertical resolution defined in line widths.

I know that this sounds weird, and I puzzled over it myself for a long while.  But realize, what this definition of sharpness, in terms of line widths, means, is how well can your lens focus down a line.  The best it can do is one pixel.  But perfection is hard to achieve.  So our expectation is something more than a pixel.

Now there are a number of test targets that you can use.  My recommendation is that you go to Jack Yeazel’s website (there’s a lot of good information about resolution measurement at that site) and do one of two things: either print out the PIMA/ISO chart or follow the link to the Edmund Scientific site and buy one.  If you go the print out route, you need to go to PhotoShop and print out the high resolution chart and use a high resolution printer.  You can examine the resolution limit of your printed target using a magnifier.  Spending the $150 for a professionally made target may be starting to sound better about now. But, I have found that printing it out works just as well.

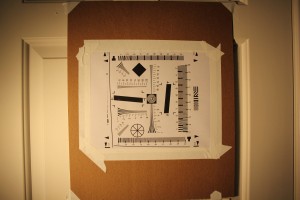
Figure 1 – The PIMA/ISO resolution target mounted on a 400 mm board to enable determining the resolution of a digital camera

Next modern digital cameras exceed the resolution of the PIMA/ISO target if you use it as originally directed.   So what you need to do, as shown in Figure 1, is to mount it on a larger board.  In my case, I mounted it on a 17 ‘ X 14 “ board.  Note the big arrows in the corners of the target.  These are 200 mm apart.  The height of the board is just over 400 mm, actually 412 mm.  Note next the nine lines that narrow horizontally and vertically.  Here’s a paradox.  The horizontal lines determine the resolution vertically and the vertical lines horizontally.  What you do is simple.  Place the camera on a tripod.  Did I mention that the camera must be mounted on a tripod, or else your resolution will be defined by handshake.  Set your camera to take raw unsharpened images.  You can use unsharpened JPEG images, but as you will see in a later blog, this can kill your resolution.  Set the camera distance such that the board just fills the screen. Then focus manually as carefully as you can.  Blow up the image on your computer (zoom in) and determine at what value you can just distinguish the lines.  Figure 2 is meant to show you this.  Whether it will or not it does depends on the resolution of your computer monitor.  So hopefullym you can see it and get the idea.

Figure 2 – Reading the vertical resolution using the PIMA/ISO target

In the Figure 2, you, again hopefully, can see that this “just see” point falls at about 7.0.  You then multiply by 200 and that gives you 1400 line widths per picture height.  The original PIMA/ISO chart was meant to be read so that it just filled the screen and multiplied by 100.  Where does 200 come from?  Because we doubled the size of the target, this should now be twice as big or 200.  My 412 mm actually makes this 206. In the next blog, we will examine a real lens using this protocol and determine how close to being pixel limited the resolution is.

This fairly straight forward procedure enables you to make a fairly sophisticated.  You are freed from being victim to such statements, found in lens reviews, like “It’s very very sharp.”  In the next technical blog we will use this procedure to evaluate the resolution of a real lens and see how it depends upon f-number.